Commodities are raw materials used for production. Therefore, one way or another you use commodities everyday of your life. Energy, electricity, food, transport, tools, clothes, EVERYTHING is made from commodities. As they are unevenly distributed on the earth surface countries must trade to get what they need, hence import/export.
This post is a kind of follow up on my previous one about commodity languages. It aims to show the amount of data you can quickly and easily find on any countries/commodities for free!
Those data could be useful when you are looking for a new position. When you get an interview/call for a new job you usually receive a specification sheet with the entire details about the position. Once this information in hand, I hardly encourage you to get to know everything about the country/region that you would face if you were hired. As a result, a study of the region history with a close look of the import/export is the bare minimum!
Think of Brazil, we all know this is the 1st sugar export. But did you know it was also the case for tobacco leaves? Now you could say, What the heck do I need to know anything about tobacco leaves if I trade sugar? Maybe the tobacco harvest may create a shortage of container in some part of the brazil which may lead to an increase in the freight price… or not. In this line of work, it’s always important to think laterally to connect the dots.
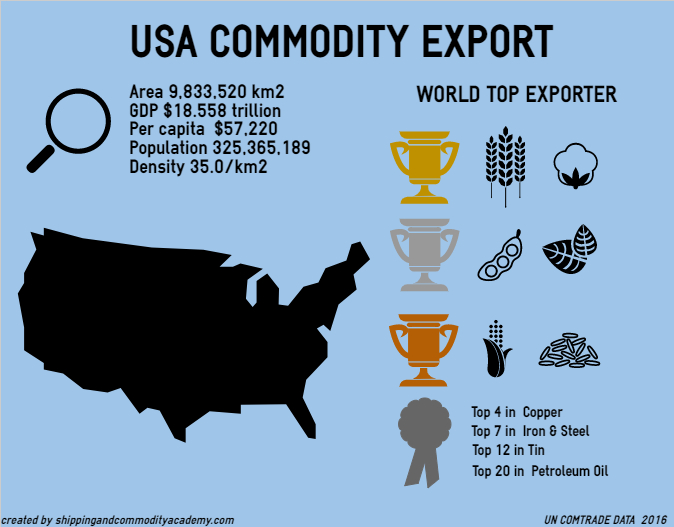
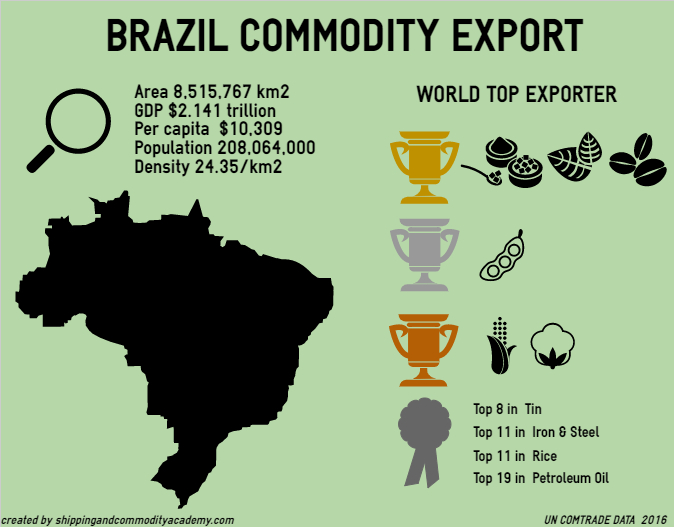
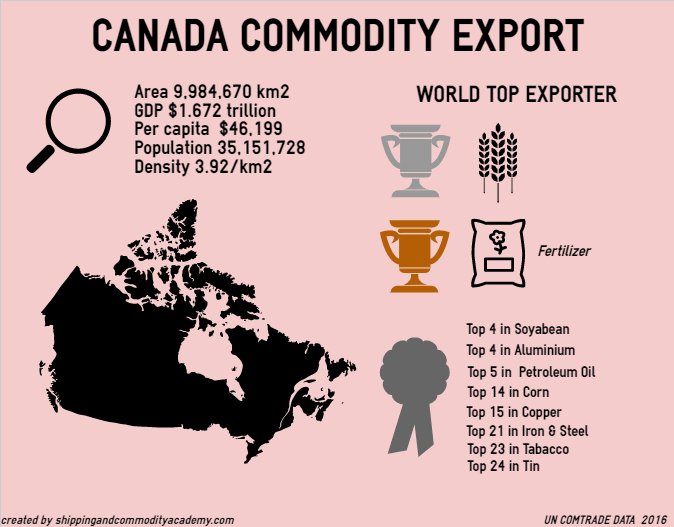
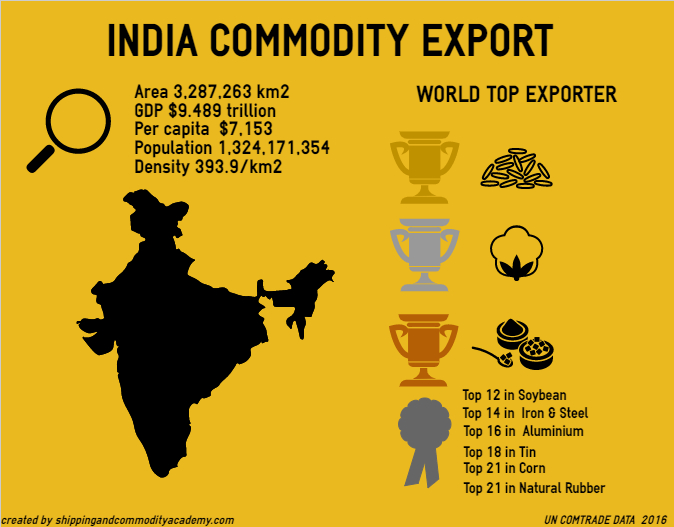
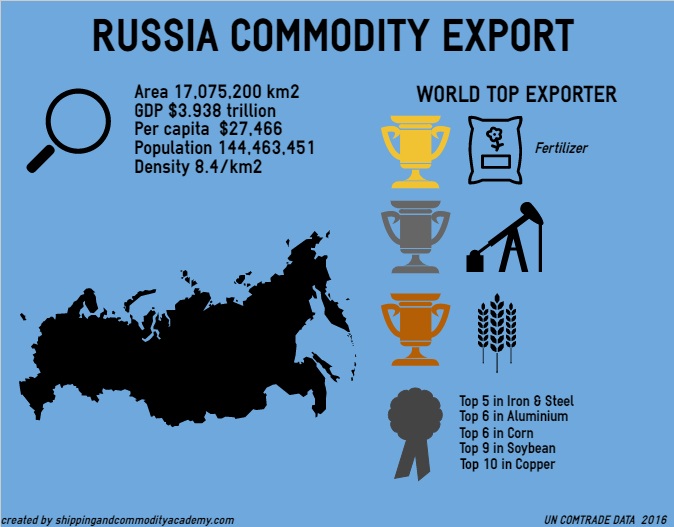
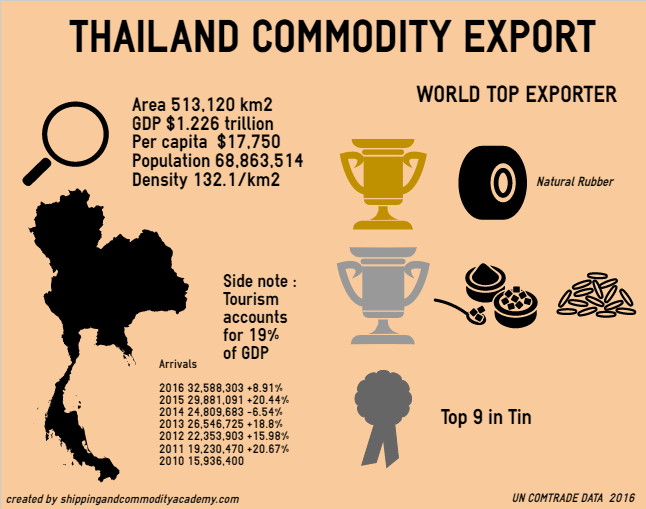
In the infographics above we are taking into account the entire tree of HS code below the numbers :
2109 Petroleum Oil / 90111 Green Coffee / 1801Cocoa Beans /1701 Sugar /1001 Wheat/ 31Fertilizer / 1006 Rice /1005 Corn / 5201 Cotton/ 8001 Tin / 74 Copper / 73 Aluminum / 72 Iron & steel /2401Tobacco /1201 Soybeans /4001Natural Rubber
You can check my previous post here if you don’t know what HS code is.
Data comes from trademap.org
